はじめに
データ分析・前処理
- xは0,1,2の3種類だったので、カテゴリ変数の扱いにしてOne-Hotエンコーディングを行ってみて。
- yは0,1,2,3の4種類だったので、カテゴリ変数の扱いにしてOne-Hotエンコーディングを行ってみて。
- timeは年、月、日、時、分で分けるが、説明変数として時間と分と曜日で利用した。
テストデータが、とある日の月曜日分のデータしかなかったため。
- directionも、カテゴリ変数の扱いにしてOne-Hotエンコーディングを行ってみて。
- 欠損値は存在しなかったので、何も対応していない。
- 外れ値もなさそうなので、何も対応していない。
- 目的変数と、その他のデータに相関関係があまりなさそうに見えたので、ほとんどの項目を説明変数にした
モデル構築時
- 説明変数は,x,y,時間,分,directionを使った。
- 線形回帰モデルとXGBoost回帰モデルを作成して、XGBoost回帰で作成したほうが精度はよかった。
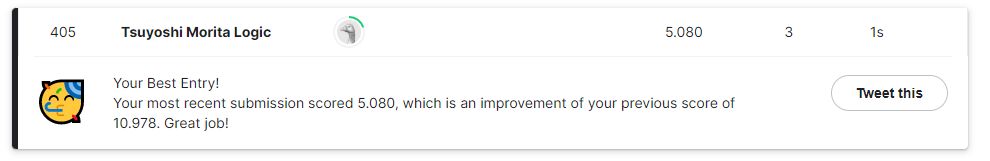
kaggleの順位は線形回帰モデル(700位)とXGBoost回帰モデル(405位)になった
よくわからず進めたところ
- XGBoostのハイパーパラメータは参考サイトをコピペして利用した。
XGBoostのサンプルを探していたときに、最初分類のサンプルに気づかず分類の記述方法をしていたが、回帰の書き方を
見つけて、調査に遠回りした。
- ハイパーパラメータの生成するのに1時間以上掛かったのがよくわからず、もっと早く生成できないものかと思いました。
- 学習する際に月曜日のデータだけに絞ってテストしたほうがよかったのかなぁと思いました。テストデータが月曜日のデータしかなかったので。
- グラフを使いこなせないので、グラフでデータの可視化をしなかった。可視化してデータを見れるようにしたい
コンペ時に利用したコード
import math
import pandas as pd
import matplotlib.pyplot as plt
import seaborn as sns
import numpy as np
import xgboost as xgb
import optuna
from datetime import datetime as dt
from sklearn.linear_model import LinearRegression
from sklearn.model_selection import train_test_split
from sklearn.metrics import mean_squared_error
from sklearn.model_selection import GridSearchCV
from sklearn.metrics import make_scorer
from sklearn.preprocessing import LabelEncoder
from sklearn.model_selection import cross_val_score

#現在の最大表示列数の出力
pd.get_option("display.max_columns")

#最大表示列数の指定(ここでは50列を指定)
pd.set_option('display.max_columns', 50)

## データの読み込み
train = pd.read_csv("train.csv")
test = pd.read_csv("test.csv")

## 欠損値の確認
train.isnull().sum()
## directionのデータの確認
train.groupby('direction').size()

def objective(trial,df_X,df_y):
    #評価するハイパーパラメータの値を規定
    params ={
        'max_depth':trial.suggest_int("max_depth",1,10),
        'min_child_weight':trial.suggest_int('min_child_weight',1,5),
        'gamma':trial.suggest_uniform('gamma',0,1),
        'subsample':trial.suggest_uniform('subsample',0,1),
        'colsample_bytree':trial.suggest_uniform('colsample_bytree',0,1),
        'reg_alpha':trial.suggest_loguniform('reg_alpha',1e-5,100),
        'reg_lambda':trial.suggest_loguniform('reg_lambda',1e-5,100),
        'learning_rate':trial.suggest_uniform('learning_rate',0,1)}

    model = xgb.XGBRegressor(n_estimators=10,
                            verbosity=0,
                            n_jobs=-1,
                            random_state=0,
                            **params)

    #交差検証
    scores = cross_val_score(model, df_X, df_y, scoring='neg_mean_squared_error',cv=5)
    score_mean = -1 * np.mean(scores)

    return score_mean

## データ前処理
def pre_data(df):
  ## 日時を月、日、時、分、週に分割
  df_date_time = pd.DataFrame({'datetime': pd.to_datetime(df['time'])})
  df['Month'] = df_date_time['datetime'].dt.month
  df['Day'] = df_date_time['datetime'].dt.day
  df['Hour'] = df_date_time['datetime'].dt.hour
  df['Minute'] = df_date_time['datetime'].dt.minute
  df['Week'] = df_date_time['datetime'].dt.strftime('%A')

  ## One-hot-Encoding
  df = pd.concat([df, pd.get_dummies(df['x'],prefix='x'),pd.get_dummies(df['y'],prefix='y'), pd.get_dummies(df['direction']), pd.get_dummies(df['Week'])], axis=1)
  ## 不要なカラムを削除
  df = df.drop(columns=['time', 'direction', 'Week'])

  ## 月曜日データのみ抽出。
  ## テストデータが月曜日だけのため。
  #train = train[train['Monday'] == 1]
  return df

## 1時間以上経過して生成されたハイパーパラメータ
## {'max_depth': 10, 'min_child_weight': 3, 'gamma': 0.8627614678291173, 'subsample': 0.9488395992082753, 'colsample_bytree': 0.9978454006405445, 'reg_alpha': 0.00048624833228949274, 'reg_lambda': 0.00016168213697343028, 'learning_rate': 0.6462794245516749}
def create_hyperparameter(X, y):
  study = optuna.create_study()
  #studyインスタンスのoptimize()に作った関数を渡して最適化する。
  study.optimize(lambda trial: objective(trial,X,y), n_trials=100)
  print(study.best_params)
  print(study.best_value)
  return study.best_params

## 線形回帰モデル(個人的な最大スコア:0.23 / kaggle : 700/756位)
def create_linear_regression_model(df):
  # 説明変数
  #target= ['x_0','x_1','x_2','y_0','y_1','y_2','y_3','Hour','Minute','EB','NB','NE','NW','SB','SE','SW','WB','Friday','Monday','Saturday','Sunday','Thursday','Tuesday','Wednesday']
  target= ['x_0','x_1','x_2','y_0','y_1','y_2','y_3','Hour','Minute','EB','NB','NE','NW','SB','SE','SW','WB','Monday']
  x = df[target].values
  # 目的変数
  y = train['congestion'].values
  # 学習データ/テストデータ分割
  # 訓練データ: 70% / テストデータ: 30%
  X_train, X_test, y_train, y_test = train_test_split(x, y, test_size=0.3, random_state=0)

  # 重回帰のインスタンス
  model = LinearRegression()

  # モデル学習
  model.fit(X_train, y_train)

  # 予測値(学習データ)
  y_train_pred = model.predict(X_train)

  # 学習データの結果
  print("##学習データの結果")
  print(model.coef_)  #回帰変数の表示
  print(model.intercept_)  #回帰直線の切片
  print(model.get_params())  #パラメータの取得
  print(model.predict(X_test))  #予測値の表示
  print(model.score(X_train,y_train))  #決定係数の表示

  # 予測値(テストデータ)
  y_test_pred  = model.predict(X_test)

  # テストデータの結果
  print("##テストデータの結果")
  print(model.coef_)  #回帰変数の表示
  print(model.intercept_)  #回帰直線の切片
  print(model.get_params())  #パラメータの取得
  print(model.predict(X_test))  #予測値の表示
  print(model.score(X_test,y_test))  #決定係数の表示

  return model

def create_xgb_model(df):
  # 説明変数
  #target= ['x_0','x_1','x_2','y_0','y_1','y_2','y_3','Hour','Minute','EB','NB','NE','NW','SB','SE','SW','WB','Friday','Monday','Saturday','Sunday','Thursday','Tuesday','Wednesday']
  target= ['x_0','x_1','x_2','y_0','y_1','y_2','y_3','Hour','Minute','EB','NB','NE','NW','SB','SE','SW','WB','Monday']
  #x = df[target].values
  # 目的変数
  #y = train['congestion'].values

  # 目的変数
  y = df["congestion"].values
  # 説明変数
  x = df[target].values

  X_train, X_test, y_train, y_test = train_test_split(x, y, test_size=0.3, random_state=100, stratify=y)
  # ハイパーパラメータを生成 1時間以上経過してようやく生成された
  #params = create_hyperparameter(X_train,y_train)

  # 上記で取得したパラメータをXGBRegressorの引数に指定する
  grid_xgb_reg = xgb.XGBRegressor(max_depth=10, min_child_weight=3, gamma=0.8627614678291173, subsample=0.9488395992082753, colsample_bytree=0.9978454006405445, reg_alpha=0.00048624833228949274, reg_lambda=0.00016168213697343028, learning_rate=0.6462794245516749)
  grid_xgb_reg.fit(X_train, y_train)

  y_train_pred = grid_xgb_reg.predict(X_train)
  y_test_pred = grid_xgb_reg.predict(X_test)

  # 裁量スコアとなるパラメータ値を出力
  #print(grid_xgb_reg.best_score_)
  print(y_train_pred)
  print(y_test_pred)

  return grid_xgb_reg


## メイン
train = pre_data(train)
# 重回帰モデル 700位の結果
#model = create_linear_regression_model(train)

# xgboostモデル 405位の結果
model = create_xgb_model(train)

## 検証データでモデルの評価
test = pre_data(test)
target= ['x_0','x_1','x_2','y_0','y_1','y_2','y_3','Hour','Minute','EB','NB','NE','NW','SB','SE','SW','WB','Monday']
x = test[target].values
result = model.predict(x)
test['congestion'] = result

## 提出用CSVファイル生成
test[['row_id','congestion']].to_csv('submission.csv', index = False)
参考文献
## 参考文献
# https://ohke.hateblo.jp/entry/2019/02/16/230000
# LabelEncoder
# https://note-tech.com/table_preprocess_summary/
# ロジット変換
# https://uribo.github.io/practical-ds/02/numeric.html
# 層化抽出: 引数stratify
# https://note.nkmk.me/python-sklearn-train-test-split/
# 【初心者】コピペでできるXGBoost回帰(※分類だった)
# https://dataanablog.com/xgboost-regression-that-can-be-done-by-copy-and-paste/
# XGBoost 回帰サンプル
# https://dataanablog.com/xgboost-regression-that-can-be-done-by-copy-and-paste/
# optuna
# https://qiita.com/mamorous3578/items/912f1a2be0e9da7e9140
# Optunaを使ったXGBoostのハイパーパラメータ最適化
# https://datadriven-rnd.com/optuna_xgboost/
# XGBoostについて(ハイパーパラメータ最適化)
# https://datadriven-rnd.com/2021-01-23-161630/
参考文献
- LabelEncoder
https://note-tech.com/table_preprocess_summary/
- ロジット変換
https://uribo.github.io/practical-ds/02/numeric.html
- 層化抽出: 引数stratify
https://note.nkmk.me/python-sklearn-train-test-split/
- 【初心者】コピペでできるXGBoost回帰(※分類だった)
https://dataanablog.com/xgboost-regression-that-can-be-done-by-copy-and-paste/
- XGBoost 回帰サンプル
https://dataanablog.com/xgboost-regression-that-can-be-done-by-copy-and-paste/
- optuna
https://qiita.com/mamorous3578/items/912f1a2be0e9da7e9140
- Optunaを使ったXGBoostのハイパーパラメータ最適化
https://datadriven-rnd.com/optuna_xgboost/
- XGBoostについて(ハイパーパラメータ最適化)
https://datadriven-rnd.com/2021-01-23-161630/
コンペ参加結果
- 405位でした。